PHM COHORT WORK
In the last few weeks, we’ve done some interesting work using our PHM+ tool across multiple PCNs. Having worked with clinicians we’ve identified a cohort of registered patients with 4 or more Long Term Conditions that have been admitted to hospital once in the last 12 months – having recognised the complexity of this cohort with potential signs of deterioration, but with the opportunity for prevention before patterns of A&E attendance become entrenched habits.
Within this cohort, we see local variation across PCNs on age profiles, demography, a leaning towards IMD 1 &2 (compared to local populations), a perhaps unsurprising increased population of smokers and obesity, as well as differences in likelihood of admission depending on address. We’ve even helped to raise a question of access inequalities in one PCN.
It’s clear that there are loads of different approaches being taken across the country to target cohorts for intervention – with some using AI-driven predictive risk stratification tools, others using the vast array of data within primary care, and others simply using anecdote.
One thing is clear though, if you have a good understanding of your primary care data, you can make in-roads quickly, starting on scalable projects to start reducing the numbers of patients attending A&E.
If you want to kickstart the PHM approach in your PCN, reach out to the team at info@primarycareanalytics.co.uk.
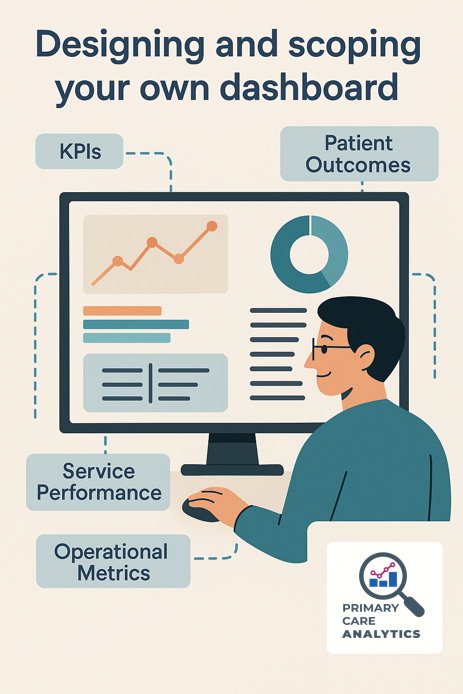
TAILOR YOUR OWN DASHBOARDS WITH PCA
Designing and scoping your own dashboard is an empowering experience that puts you in control of the insights most relevant to your Practice, PCN, or Federation. Instead of relying on generic templates or what others tell you is important, creating your own dashboard allows you to define what success looks like through the lens of your unique priorities. Imagine having all the key pieces of information—such as KPIs, patient outcomes, service performance, and operational metrics—laid out clearly in one accessible place. It’s about capturing what truly matters to you, whether that’s tracking progress against your OKRs, visualizing your balanced scorecard, or showcasing the impact of your innovative services.
This process transforms data from daunting numbers into a tailored, strategic tool that guides decision-making and inspires action. With PCA, you can design your dashboard to reflect your specific goals, highlight areas for improvement, and celebrate your successes—all in a way that feels meaningful and motivating. Developing it around your own metrics and objectives ensures that the insights you gain are directly relevant, helping you drive continuous improvement and deliver better outcomes for your community. It’s a personalized approach to analytics that champions your vision and strengthens your local impact.
If you would like to discuss your own bespoke view of data, message the team at info@primarycareanalytics.co.uk to discuss how PCA can support you.
KEEP INSIGHT FLOWING – EVEN IN SUMMER
As we reach the end of Summer, how have you managed your staffing? Have well-earned holidays left your teams short of the skilled staff that support your data and analytics?
The need to improve the health needs of our communities doesn’t take a holiday – that’s where Primary Care Analytics can make a real difference.
With a dedicated team of analysts on your side, your data continues to work for you all year round. We ensure that insight doesn’t pause just because the diary is full of annual leave requests. From monitoring key population health trends to supporting ongoing projects, our analysts keep the momentum going and the data flowing – so you return to work with a clear, current picture and no backlog of unanswered questions.
Continuity is built on more than systems – it’s built on people who understand your priorities, your population, and your context. That’s why, whether it’s February, August, or December, our team is here to keep your data flowing.

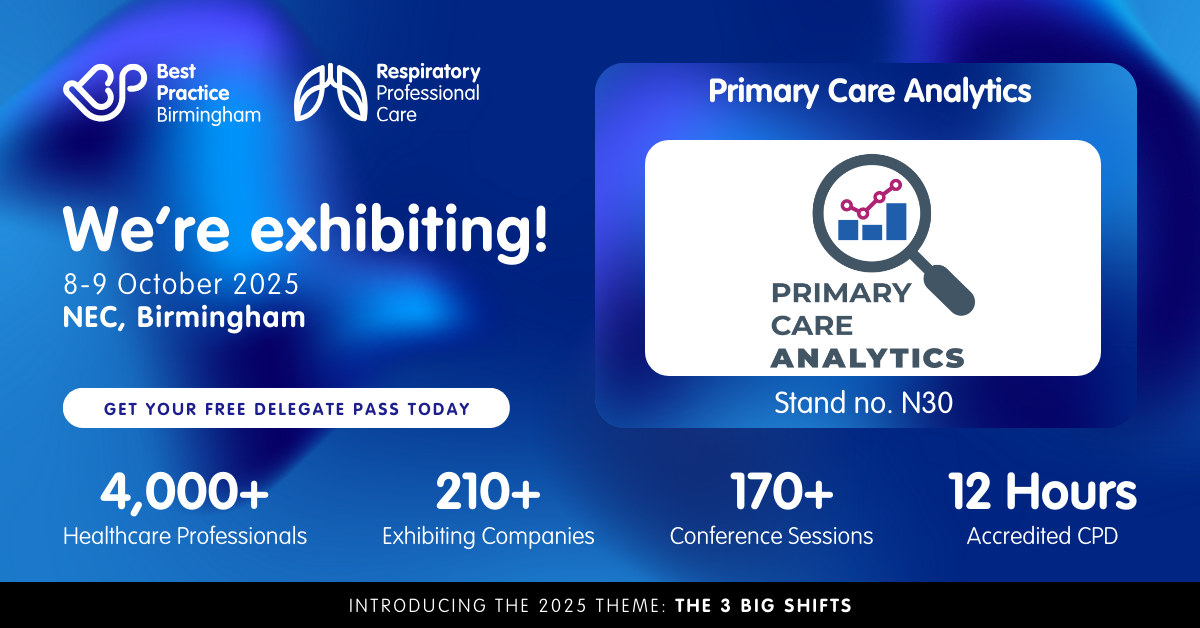
CONFERENCE SEASON IS APPROACHING
As we return to normal after the summer break, we’re starting to turn our attention to the conference season.
Over the next couple of months, look out for us popping up at conferences, including Management in Practice in London (Register Here), as well as Best Practice in Birmingham (Register Here).
Keep an eye out for updates for some of the exciting plans we have for Best Practice!
REDMOOR BLOG
Finally, we told you in the last email about our webinar with Redmoor Health, which you can find here, this has also now been turned into a blog by Clare Temple at Redmoor. Our Medical Director Lauren’s contributions to the webinar have been included in the blog, demonstrating some of the ways that Taurus Healthcare have used the analytics that we have supplied to turn PHM into action. You can find the blog here, with examples including vaccinations, cervical screening health inequalities, and frailty interventions.